hero background shape
supply-chain_03_hero
Use Case

Site Selection Optimization

hero background gradient
 

Site selection has always been a high-risk process for retailers, often characterized by decisions made across multiple siloed data sources. Now retailers can sharply reduce risk in their site selection process by overcoming silos, integrating spatial and non-spatial data, and applying on-demand analytics.

Top-Line Growth

Place new locations in areas where your product is in highest demand

Bottom-Line Returns

Optimize product mix and reduce out-of-stock conditions

Risk Reduction

Fully understand factors that affect location performance


Business Problem

Most retailers select sites using a combination of competitor insight, market data, location planning, and strategic fit. It’s a data-driven decision because investment in a retail location involves the upside of increased market share with the downside of real estate risk in a given area. Even though most retailers have abundant data available, that data often resides in spreadsheets or silos around the organization, or in limited mapping and reporting tools. Pulling together a risk profile of a particular location is a labor-intensive process fraught with error.

Analytics Solution

Spatial analysis enables companies to blend geographic and descriptive data together from a variety of sources and use that data in geographic models and visualizations. In a form of geographic business intelligence, companies build models from geospatial data on locations, relationships, and attributes. Spatial analysis goes beyond the traditional Geographic Information Systems (GIS) framework of displaying descriptive information on a map, now reaching into data science and machine learning. The combination of cloud computing, geospatial data, on-demand analytics, and rich reporting pushes BI-based insights down to the level of individual stores, departments, and product categories. For retail site selection that means that property managers can incorporate point-of-sale data into their selection and forecasting models. They can include previously impractical data on urban storefronts, shopping centers, endcaps or pads, parking, view corridors, and zoning.

With Alteryx, you can:
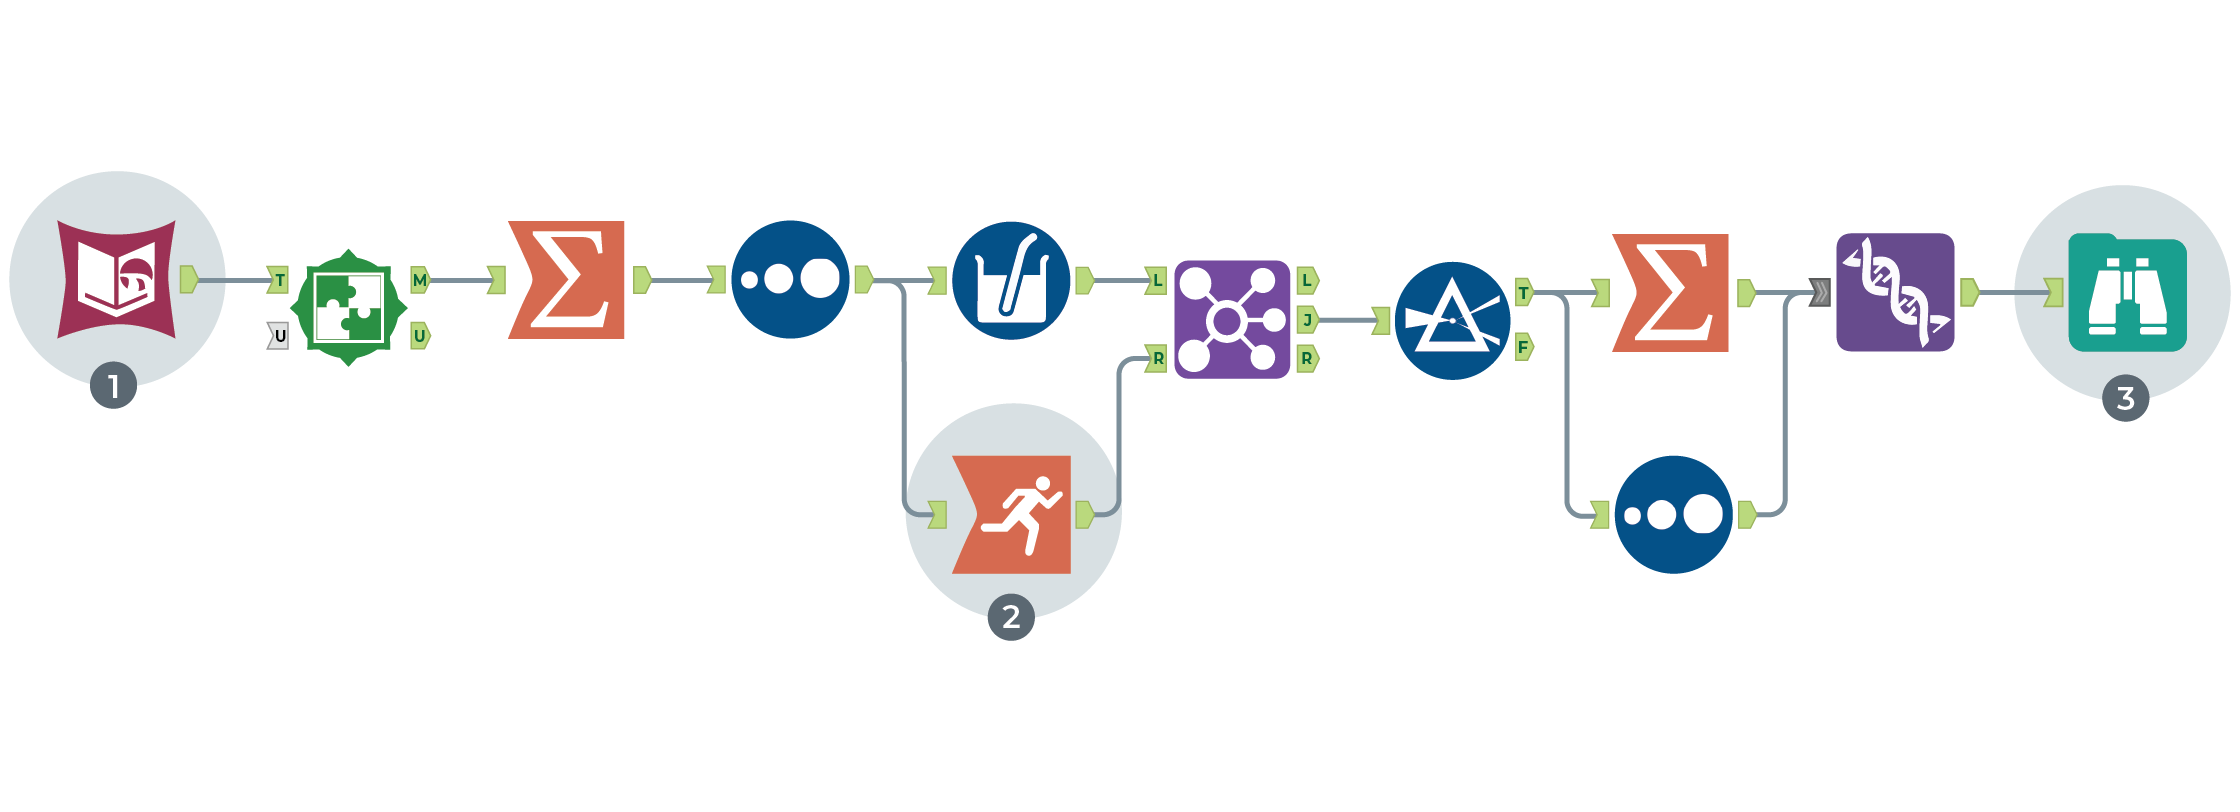
  • Download the Spatial Analytics Starter Kit to combine customer value data, customer location, and new store location data to analyze customer behavior and increase top-line revenue.
  • Create store trade areas based on customer distance to stores to put products in the hands of more customers.
  • Blend spatial data to calculate ad area distribution, increase sales, and reach more customers.
 

1 – Data Connection

Pick relevant geographic variables from datasets using Allocate Input Tool

2 – Prep & Blend

Use Running Total Tool to enrich imported data

3 – Data Visualization

View optimized routes or connect directly to supply chain software


Additional Resources


Starter Kit for Spatial Analytics
Learn More
 
 
Starter Kit for Intelligence Suite
Learn More
 
 
Starter Kit for Tableau
Learn More
 
 
Starter Kit for Snowflake

Learn More
 

Recommended Resources

 
Customer Story
Kurt Geiger Uses Alteryx to Improve Shopper Frequency and Drive Social Impact
Kurt Geiger, purveyor of luxury footwear, handbags and small leather goods leans into data & analytics to improve shopper frequency by 15% whilst fueling their philanthropic customer loyalty programme, Kurt Cares.
  • BI/Analytics/Data Science
  • Data Analytics
  • Marketing
Learn More
 
E-Book
The Supply Chain Analyst’s Guide to AI-Assisted Analytics
Read this guide to learn how to use AI-guided analytics to gain end-to-end visibility throughout supply chain operations and build resilience by empowering everyone with data insights.
  • Analytics Automation
  • Professional
  • Supply Chain
Read Now
 
White Paper
A single source of truth for data: Simplifying trade tax and strengthening supply chains
Unlock greater trade efficiency with PwC and Alteryx
  • Supply Chain
  • Manufacturing
  • Retail and Consumer Goods
Read Now